 E2 has published new, interesting data on clean energy jobs by congressional districts. Clean energy employment[1] (jobs in renewable energy and energy efficiency) accounts for 3 million U.S. jobs, and the sector will likely grow following the passage of the massive infrastructure bill. E2’s searchable database allows users a closer look at where those jobs are.
Interesting Highlights
Among the more interesting highlights of the report are:
Clean energy jobs create more occupations across more sectors than almost any other sector of the economy.
- One out of 50 jobs in America is in the clean energy sector.
- The energy efficiency sector has the largest number of total clean energy jobs, with more than 1 million people employed in this sector.
- California’s Seventeenth Congressional District has the most clean energy jobs at 33,109.
- Texas’ Second Congressional District has the third-highest number of jobs at 32,414.
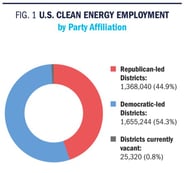
- Data shows that the distribution of clean energy jobs in America crosses all political boundaries, with clean energy jobs in all 436 congressional districts (including the District of Columbia).
- There are 286 Congressional Districts with more than 5,000 clean energy jobs and 79 with more than 10,000.
- Jobs are nearly evenly distributed between Republican-controlled and Democratic-controlled districts.
A searchable database on the organization’s website allows users to search by zip code and learn how many clean energy jobs are in their congressional district.
Why It Matters
The analysis[2] highlights the strength of the clean energy sector in terms of the number of people employed. These numbers demonstrate to congressional leadership the importance of this sector to jobs and the overall economy.
[1] E2 defines clean energy jobs as those in solar or wind energy, combined heat and power, bioenergy, non-woody biomass, low-impact hydropower, geothermal, and energy efficiency, among other categories. Jobs in retail trade, repair services, water or waste management, and indirect employment or induced employment are not included.
[2] E2’s analysis expands on the Clean Jobs in America 2021 report and is based on preliminary employment data collected and analyzed by BW Research in Partnership for the 2021 U.S. Energy and Employment Report (USEER) released by the Department of Energy (DOE).