For more than 25 years, the ENERGY STAR® Homes program has positioned itself as the market leader in cost-effective, energy-efficient new home construction. The Environmental Protection Agency (EPA) advertises that homes built to ENERGY STAR specifications are 10 to 20 percent more efficient than homes built to code1. But behind the advertising claim, what does an ENERGY STAR really demand from homes bearing its label? The ENERGY STAR Homes program reference designs for Versions 3 and 3.1 include 2009 and 2012 International Energy Conservation Code (IECC) envelope requirements, respectively. Oddly, the program’s inspection checklists only require the thermal envelope to meet 2009 IECC prescriptive requirements. ENERGY STAR also allows homes to go below 2009 IECC insulation2 levels if improved air sealing is achieved.
Can you really call a home built to 2009 thermal envelope requirements highly energy efficient? While these measures may provide flexibility to builders, the program truly misses the mark of driving high-performance, energy-efficient home construction. With the recent enactment of the 2021 International Energy Conservation Code, Energy Star might as well drop out of the conversation about zero energy ready or high-efficiency construction.
Prescriptive insulation requirements in the 2012, 2015, 2018, and 2021 versions of the IECC are substantially more stringent than the 2009 IECC, a subject we’ve written about previously. These new, improved levels of insulation are both cost-effective and feasible.3 However, over four code cycles, the minimum ENERGY STAR program requirements have not changed. This led NAIMA to ask some questions: What R-values are being installed in ENERGY STAR homes? How do the thermal envelope values in ENERGY STAR homes compare to the model code requirements or other non-ENERGY STAR homes?
To answer these questions, NAIMA looked at construction data from the Residential Energy Services Network (RESNET) registry and compared ENERGY STAR homes vs. Non-ENERGY STAR homes to better understand the thermal enclosure differences. This information is based on homes built from 2017 to 2020. It consists of single-family home data from seven of the top volume states ENERGY STAR homes4 across various Climate Zones – Arizona, Texas, Maryland, North Carolina, Colorado, Nevada, and New Jersey. Two northern states, Minnesota and Massachusetts, were added to round out the range of climate zones.
Thermal Envelope Comparison
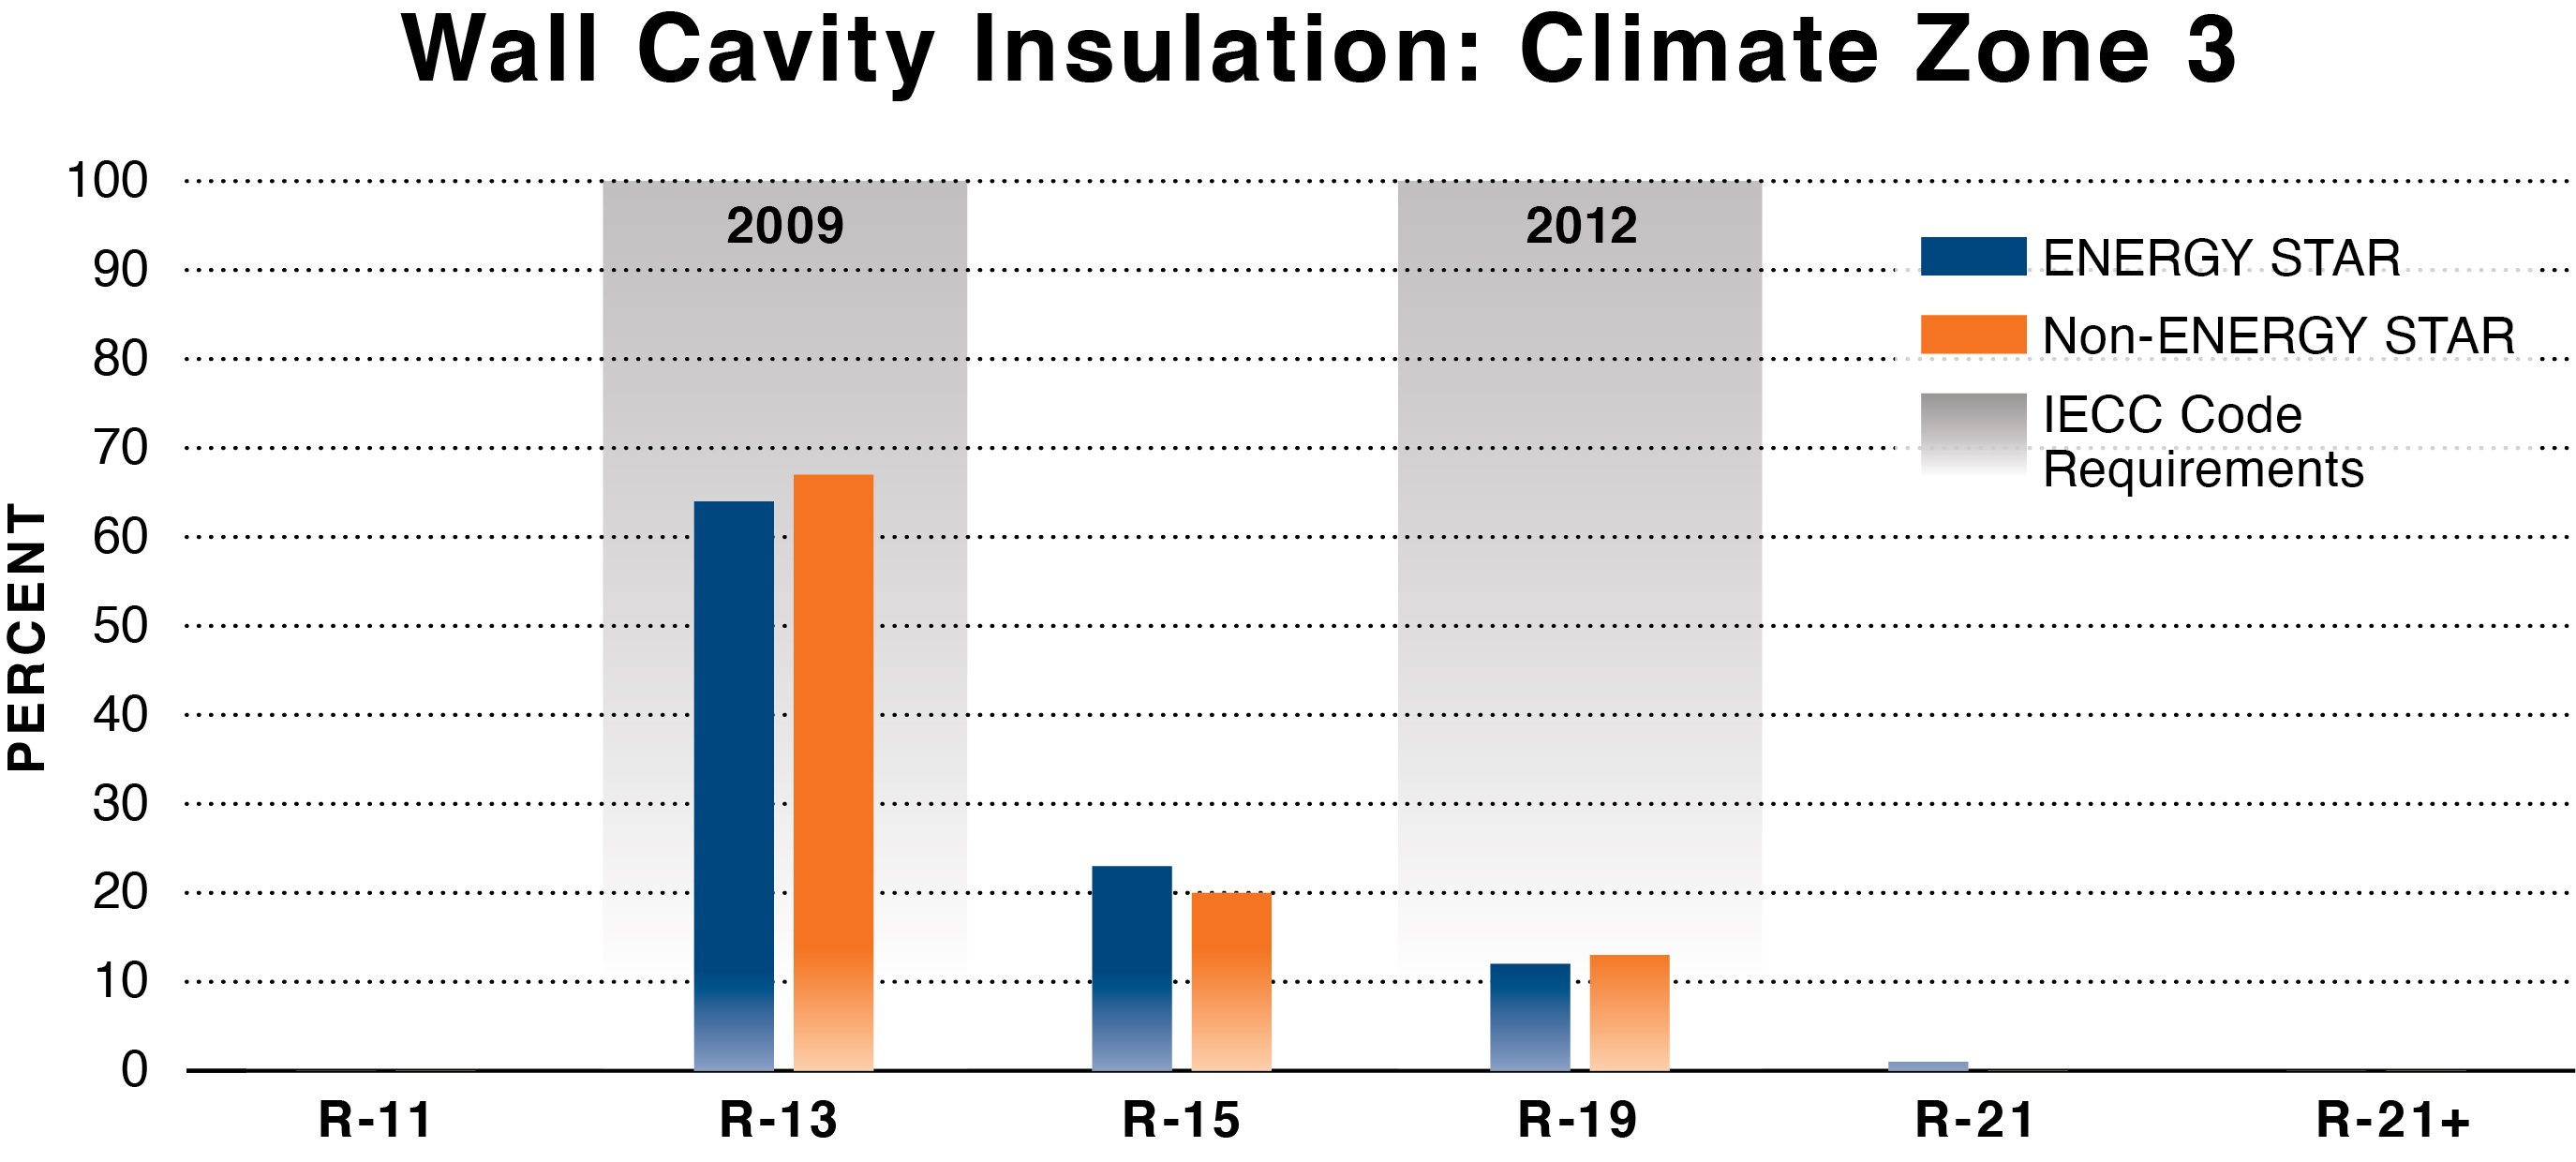
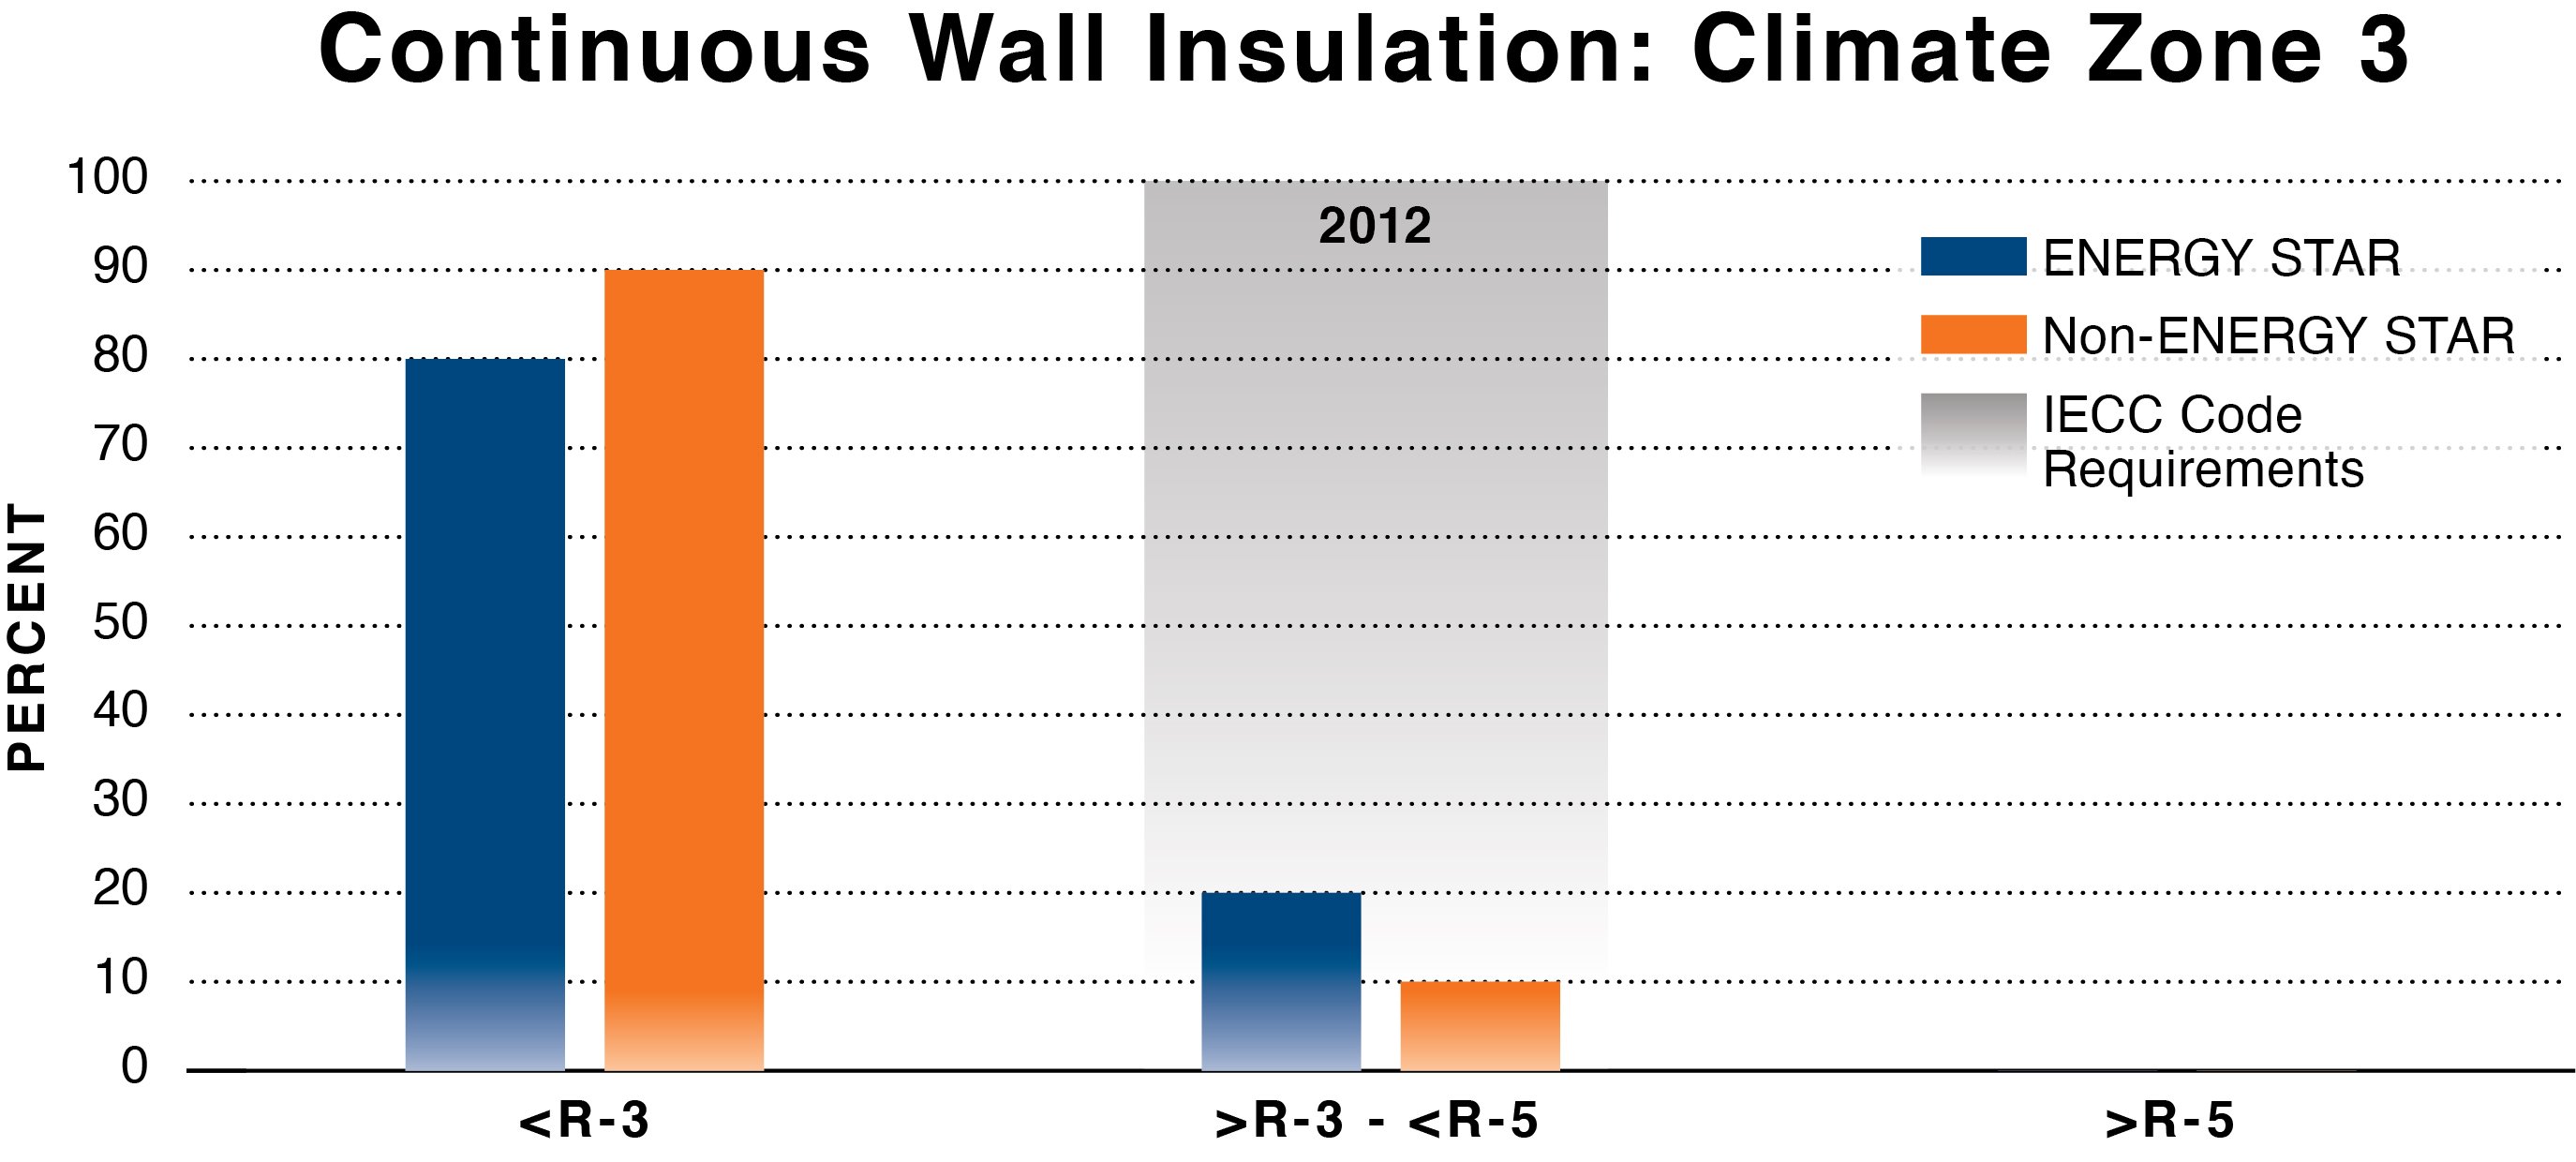
Figure 1: Climate Zone 3 Walls
- No notable differences between ENERGY STAR and non-ENERGY STAR homes
- ENERGY STAR Average: R-14 and, if included, R1.5 continuous
- Non-ENERGY STAR Average R-14 and, if included, R-1 continuous
Figure 1 (above) portrays Climate Zone 3 wall cavity insulation and continuous wall insulation. The average cavity insulation is the same for both ENERGY STAR and Non-ENERGY STAR homes, with ENERGY STAR exceeding Non-ENERGY STAR by ½ of an R-value for the average of continuous insulation (CI) in the region. The graph also illustrates the 2009 and 2012 IECC code requirements. More than 60 percent of ENERGY STAR homes and Non-ENERGY STAR Homes install cavity insulation to the same values of the 2009 IECC. At the same time, 80-90 percent of ENERGY STAR and Non-ENERGY STAR Homes use less CI than required by the 2012 IECC. It is worth noting that there was no CI requirement of the 2009 IECC.
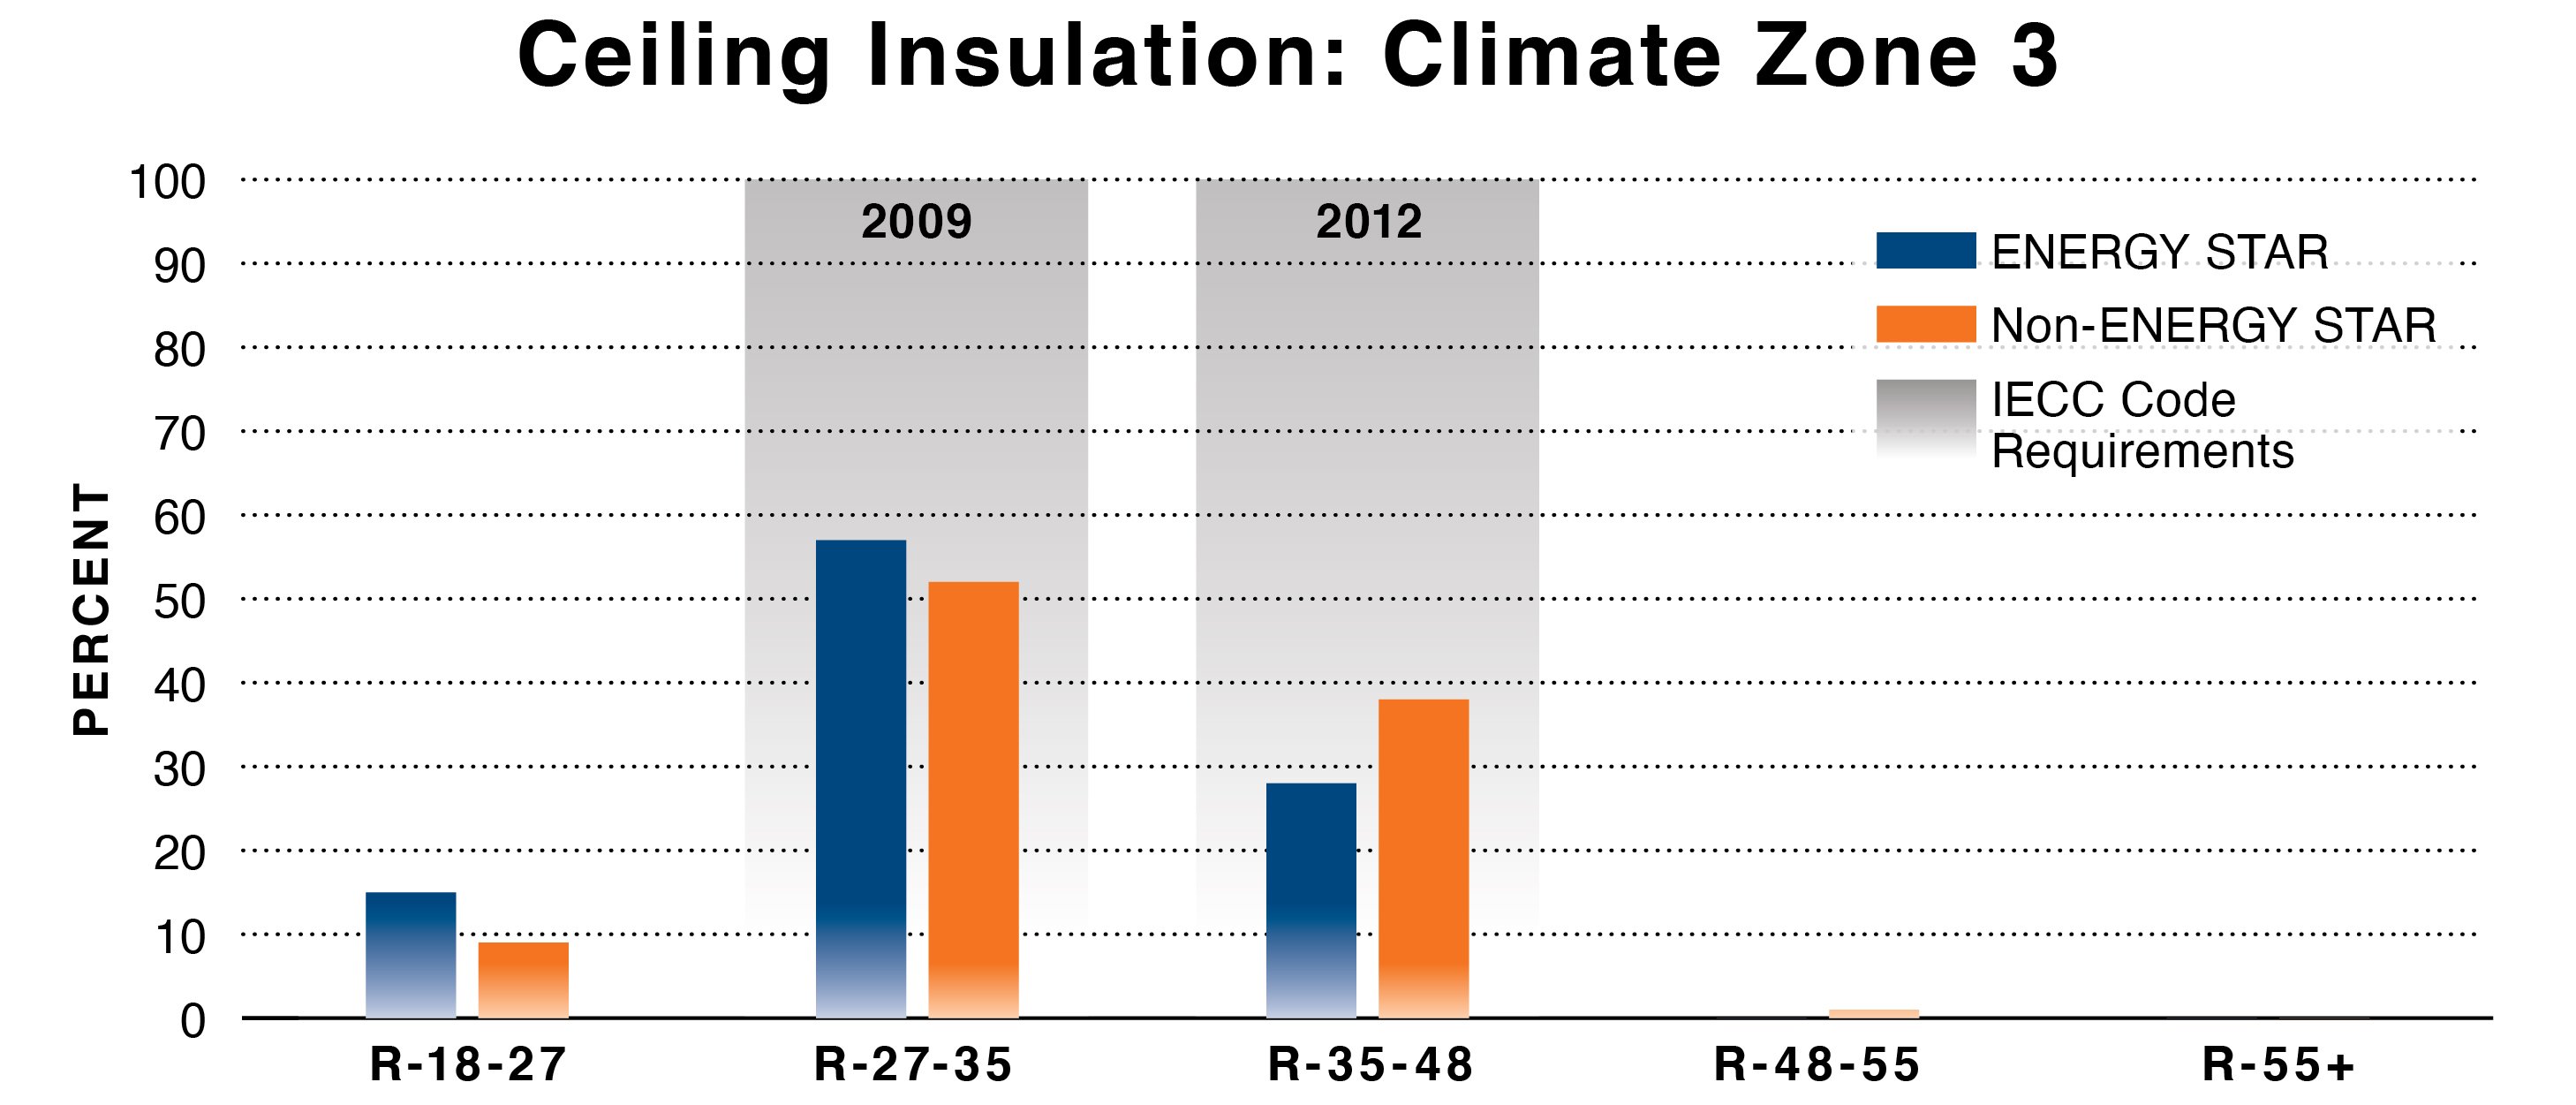
Figure 2: Climate Zone 3 Ceilings
- Non-ENERGY STAR homes are outperforming ENERGY STAR homes in ceiling insulation values.
- Over 50 percent of ENERGY STAR and non-ENERGY STAR home insulation values are equivalent to the 2009 IECC code requirement of R-30.
- ENERGY STAR average: R-33
- Non-ENERGY STAR average: R-35
Figure 2.0 (above) shows ceiling insulation R-values in Climate Zone 3. More than 50 percent of both ENERGY STAR and Non-ENERGY STAR homes have ceiling insulation that is equivalent to the 2009 IECC. Non-ENERGY STAR homes have average ceiling insulation of R-35, slightly better than ENERGY STAR Homes average of R-33.
Conclusion
The RESNET data analyzed by NAIMA shows a clear indication that the homes certified as ENERGY STAR Homes in recent years are not the market leaders in energy-efficient construction. While model codes have made significant energy efficiency improvements over the last several cycles -- especially in the thermal envelope-- ENERGY STAR has gone from industry leader to laggard. Most purchasers of ENERGY STAR homes buy a promise their home will deliver superior energy performance over code-built homes. It appears ENERGY STAR has some catching up to do to remain true to that promise.
References
1“About the energy STAR Residential new construction program. (n.d.). Retrieved from https://www.energystar.gov/partner_resources/residential_new/about
2 ENERGY STAR Single-Family New Homes National Rater Design Review Checklist, Version 3/3.1 (Rev.11). (n.d.). Retrieved from https://www.energystar.gov/sites/default/files/National%20Rater%20Design%20Review%20Checklist_Rev%2011.pdf?abed-7348
3 Mendon, V., Lucas, R., & Goel, S. (2013, April). Www.pnnl.gov (U.S. Department of Energy). Retrieved from https://www.pnnl.gov/main/publications/external/technical_reports/PNNL-22068.pdf
4 Energy star single-family new homes map. (n.d.). Retrieved August 30, 2021, from https://www.energystar.gov/newhomes/energy_star_certified_new_homes_market_share